Creating a bubble map is a fantastic way to visualize ideas and concepts.
To make a bubble map in Canva, one simply needs to log in or sign up for a free account and choose a template to customize. This tool allows for easy design and collaboration, making it perfect for students, teachers, or anyone looking to organize thoughts visually.
Canva’s user-friendly platform provides various templates and design elements.
Users can drag and drop, add colors, images, and even icons to bring their ideas to life. This flexibility makes it an excellent choice for those who want to create clear and engaging visual aids.
Whether for brainstorming sessions, presentations, or study aids, a bubble map can enhance understanding and retention of information. Anyone can quickly turn their thoughts into an appealing visual format that communicates effectively.
Getting Started with Canva
To begin using Canva, users need to create an account first.
After that, they will explore the easy-to-navigate interface that Canva offers. This makes designing projects straightforward and fun.
Creating a Canva Account
Getting started with Canva is simple.
Users can sign up for a free account by visiting the Canva website. They can choose to create an account using their email, Google account, or Facebook.
Once they select their preferred method, they enter their information. After completing the registration process, users will receive a welcome email. It’s essential to confirm their email to fully activate the account.
Canva also offers paid plans, providing extra features like premium templates and images. Users can explore these options later based on their needs.
Overview of Canva Interface
Once logged in, users will see the main dashboard. The design space is clean and user-friendly.
On the left side, there is a menu with various options. This includes templates, elements, uploads, and text.
To create a new design, users simply click on the “Create a design” button in the top right corner. This opens a menu of sizes and formats, including the option for a custom size.
In the center, users have their workspace. Here, they can drag and drop elements from the menu to build their designs. Tools at the top help with fonts, colors, and other adjustments.
Navigating through Canva is intuitive, making it easy for anyone to start designing right away.
Understanding Bubble Maps
Bubble maps are useful tools for organizing and visually displaying ideas. They help users connect concepts, making information easier to grasp. Here’s a closer look at their definition and key parts.
Definition and Purpose
A bubble map is a type of graphic organizer used to display relationships between a central idea and related ideas.
The main concept is placed in the center, surrounded by bubbles that represent associated thoughts or terms.
This structure allows users to see connections clearly. For example, in a bubble map about a book, the title could be in the middle, while characters, themes, and settings branch out. This design not only encourages creativity but also enhances understanding by providing a visual representation.
Components of a Bubble Map
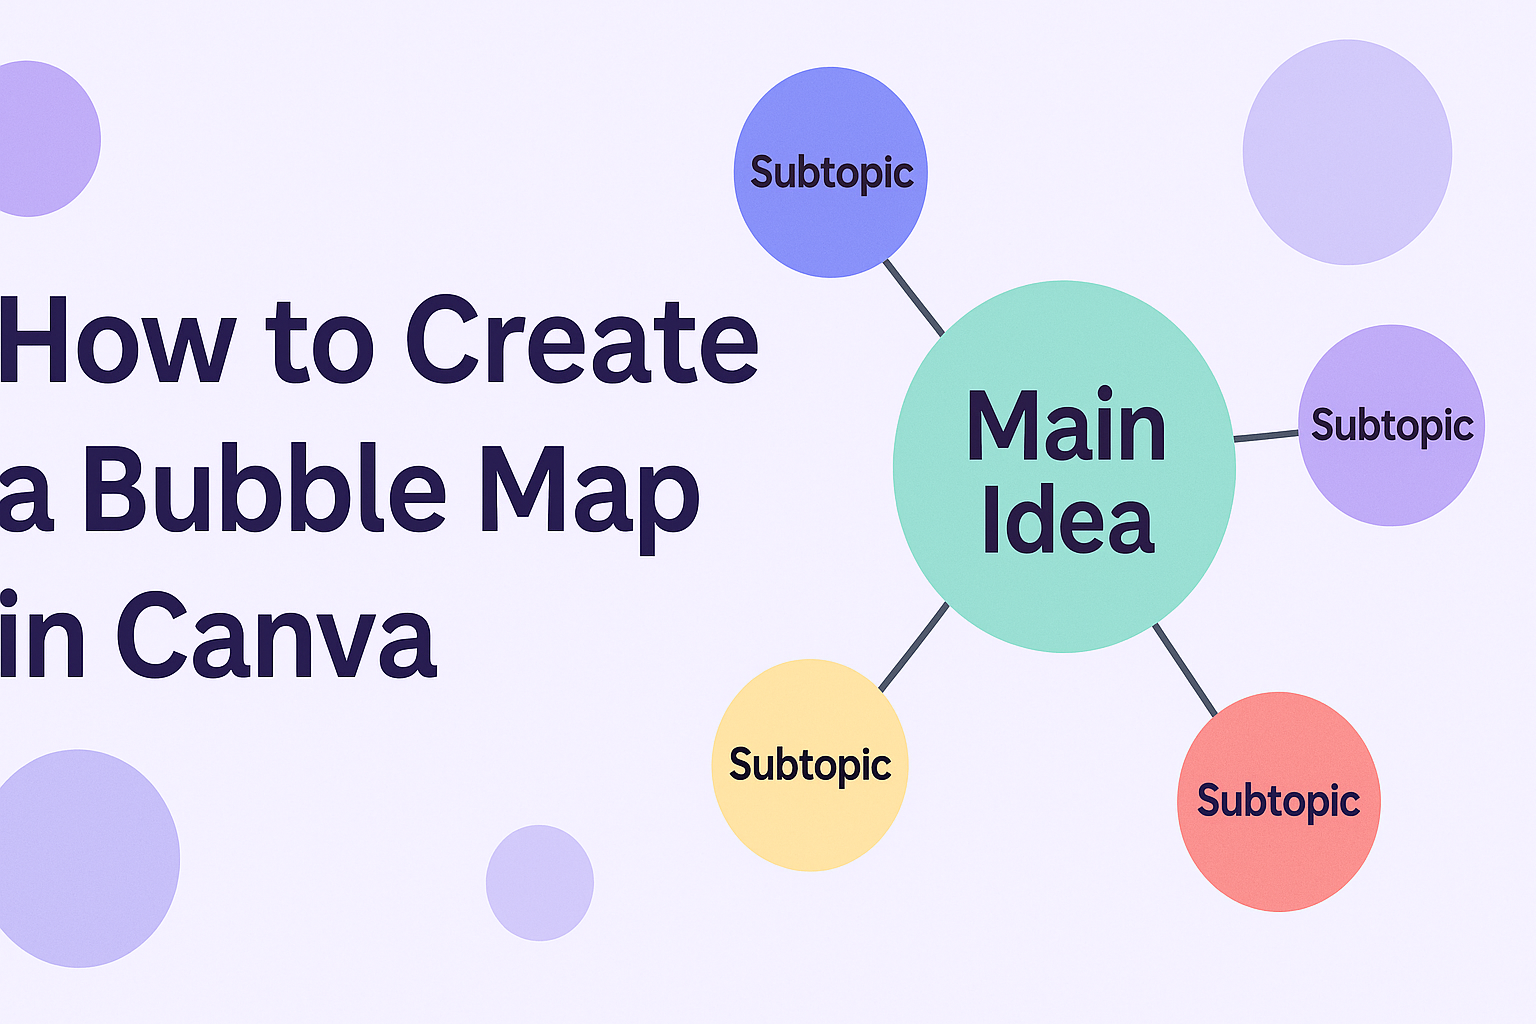
A bubble map consists of several important elements:
- Central Bubble: This is where the main idea is displayed. It’s typically larger and placed in the center.
- Connected Bubbles: These represent related ideas or terms. They connect to the central bubble with lines or arrows, showing relationships.
- Visual Elements: Colors, images, and icons can be added to make the map more engaging. This can help highlight key points.
By combining these elements, bubble maps create a clear and engaging way to visualize thoughts. Users can easily navigate through the information, making it a powerful tool for brainstorming and planning.
Designing Your Bubble Map
Creating a bubble map in Canva is a fun way to visualize ideas. The design process includes choosing a suitable template, customizing the design elements, and adding text that explains the connections between concepts.
Choosing the Right Template
To start, selecting the right template is key. Canva offers various templates for bubble maps.
A user should log in to Canva, then click on “Create a design.” After that, they can type “bubble map” in the search bar.
By browsing through the templates, they can find one that fits their needs. Each template has unique layouts and styles. Pick one that resonates with the ideas being mapped out. This sets a strong foundation for the rest of the project.
Customizing Your Design
Customizing the chosen template is where creativity shines.
Users can change colors, shapes, and sizes of the bubbles. This is done through simple clicks and drags.
Canva allows for easy adjustments to backgrounds and connecting lines as well. Adding images and icons can make the bubble map more appealing and meaningful.
Using consistent fonts and color schemes helps create a cohesive look. It makes the map not just informative but also attractive to the viewer. This can enhance understanding and engagement.
Adding and Editing Text
Text adds clarity to a bubble map, explaining each idea or concept.
When adding text, it’s essential to keep it concise and clear.
Users can simply click on a bubble and type a short phrase summarizing the idea.
Editing text is equally straightforward. Canva allows changes in font style, size, and color. This ensures that the text stands out against the background.
It’s best to use bullet points or short phrases. This keeps information digestible. Regularly reviewing the text while designing helps to make sure it aligns with the visual elements.
Inserting Bubbles and Connecting Lines
Creating a bubble map involves adding bubbles to display ideas and connecting them with lines for clarity. This process helps visually organize thoughts and creates relationships between concepts.
Adding Bubbles
To start adding bubbles, the user must log into Canva and open their existing bubble map design or create a new one. Once in the design, they can find the “Elements” tab on the left side of the screen.
Next, they should search for “bubble” or “circle” to find various bubble shapes.
By clicking on a bubble, it will appear on the design canvas. Users can then resize and move the bubble as needed.
For better organization, placing bubbles in a logical order helps. They can also adjust the color and text inside each bubble to fit their theme. This customization provides a more appealing look and makes the map easier to understand.
Connecting Ideas with Lines
Connecting bubbles with lines is crucial for showing relationships.
The user can go back to the “Elements” tab and search for “line” or “arrow” to find suitable connectors. Once a line is selected, dragging it from one bubble to another helps visualize the connection.
Users can adjust the width and style of the line in the editing toolbar. A thicker line can indicate a stronger relationship, while arrows can show direction or flow of ideas.
It’s essential to ensure that lines don’t overlap confusingly. Clear connections make the bubble map more effective and easier to read. By thoughtfully placing lines, users can create a clear, informative layout.
Styling Your Map
When designing a bubble map, styling is key to making it visually appealing and effective. Adjusting colors, modifying line styles, and using a brand kit can enhance clarity and cohesiveness. Here’s how to do it effectively.
Adjusting Bubble Colors and Sizes
Choosing the right colors for the bubbles can significantly impact the map’s readability. Canva allows users to select colors that match their ideas or themes.
Users can click on a bubble and choose a color from the palette.
Tips for adjusting sizes:
- Use larger bubbles to represent more significant ideas or data points.
- Consistency is essential, so maintain a standard size for similar items.
For a good mix, she might select a few colors that contrast well. This contrast helps to draw attention to important elements within the map.
Changing Line Styles
Lines can give structure to a bubble map by connecting ideas clearly. Canva offers various line styles to choose from.
Users can select solid, dashed, or dotted lines, depending on the desired effect.
To modify line styles:
- Click on the line you want to change.
- Choose the style from the options available in the toolbar.
Using different styles can emphasize certain connections. For instance, thick lines may indicate stronger relationships, while lighter lines can suggest weaker ties.
Using Brand Kit for Uniform Style
For those with a brand kit, Canva makes it simple to apply consistent branding to a bubble map.
When she uses the brand kit, colors, fonts, and logos that align with her brand will be easy to incorporate.
Steps to use the brand kit:
- Access the brand kit from the Canva dashboard.
- Choose fonts and colors that represent the brand.
Applying these elements can give the map a professional look. A cohesive design makes it easier for viewers to connect the dots between ideas.
Working with Images and Icons
Images and icons are essential for enhancing a bubble map in Canva. They add visual interest and can help to convey ideas more effectively. Knowing how to import images and incorporate icons makes the design process smoother and more creative.
Importing Images
To import images into Canva, a user can easily drag and drop an image from their computer into the workspace, or click on the “Uploads” tab in the toolbar. From there, clicking on the “Upload an image or video” button allows the user to browse files.
Once the image is uploaded, it appears in the sidebar for quick access. Users can also adjust the size by dragging the corners or moving it around the bubble map. To maintain the aspect ratio, holding the Shift key while resizing is helpful.
Additionally, Canva offers a range of free images in its library. Users can search for specific images using keywords. Importing images adds a personal touch to the bubble map.
Incorporating Icons
Incorporating icons can greatly enhance a bubble map’s visualization.
Users can access icons through the “Elements” tab, where they can search for specific icons related to their ideas.
Using icons helps to simplify complex concepts visually. Once an icon is selected, it can be resized, rotated, and colored. The color can be changed using the “Fill” option in the toolbar, which allows for solid or gradient colors.
It’s important to choose icons that match the theme of the bubble map for consistency. Icons can be layered on top of images or bubbles, creating a clean and organized layout. This thoughtful use of icons will make the design more engaging and informative.
Collaboration and Sharing
Canva provides effective tools for users to collaborate and share their bubble maps easily. This section covers how to invite team members and share maps for feedback.
Inviting Team Members
To make collaboration seamless, users can invite team members directly to their design.
First, the user needs to open the bubble map they created. Then, they should click the Share button located at the top right corner.
Next, the user can enter the email addresses of team members they want to invite. Before sending the invite, they can choose the access level, such as Can edit or Can view. This choice helps control how others interact with the map. After the details are set, users can hit Send Invite. The invited team members will receive an email with a link to access the design.
Sharing the Map for Feedback
Sharing a bubble map for feedback is straightforward in Canva. After finishing the design, the user can click on the Share button again. This time, they can copy a link for the map.
When sharing, the user can select options for feedback. They can allow others to comment only or give full editing rights. This feature is useful for collecting different perspectives on the map. To send it out, the user can share the link via email or messaging apps. This makes it easy for everyone to provide input without any hassle.
Finalizing and Exporting
Once a bubble map design is complete, it’s essential to review the final touches and prepare for export. This step ensures that the design meets expectations and is ready for sharing or printing.
Reviewing the Design
Before exporting, it’s crucial to conduct a thorough review of the bubble map.
Check for any spelling errors, misplaced elements, or aesthetic issues. Look at the size and position of each bubble. Adjust colors and fonts if needed to enhance readability.
Use the zoom feature to see details up close. It helps in spotting any small mistakes. It can also be helpful to take a break and return with fresh eyes. Asking a friend for feedback can provide valuable perspectives as well.
Exporting Your Bubble Map
Once the design is perfect, exporting it is the next step. Click on the “Share” button or “Download” option.
Canva offers several formats for export, including PNG, JPG, and PDF. Each format serves different purposes.
For online sharing, PNG or JPG is preferred. For printing, PDF is often the best choice.
After selecting the format, choose the desired quality. High resolution is essential for clarity, especially when printing.
Finally, click “Download” to save the file. It will be ready for use in no time!