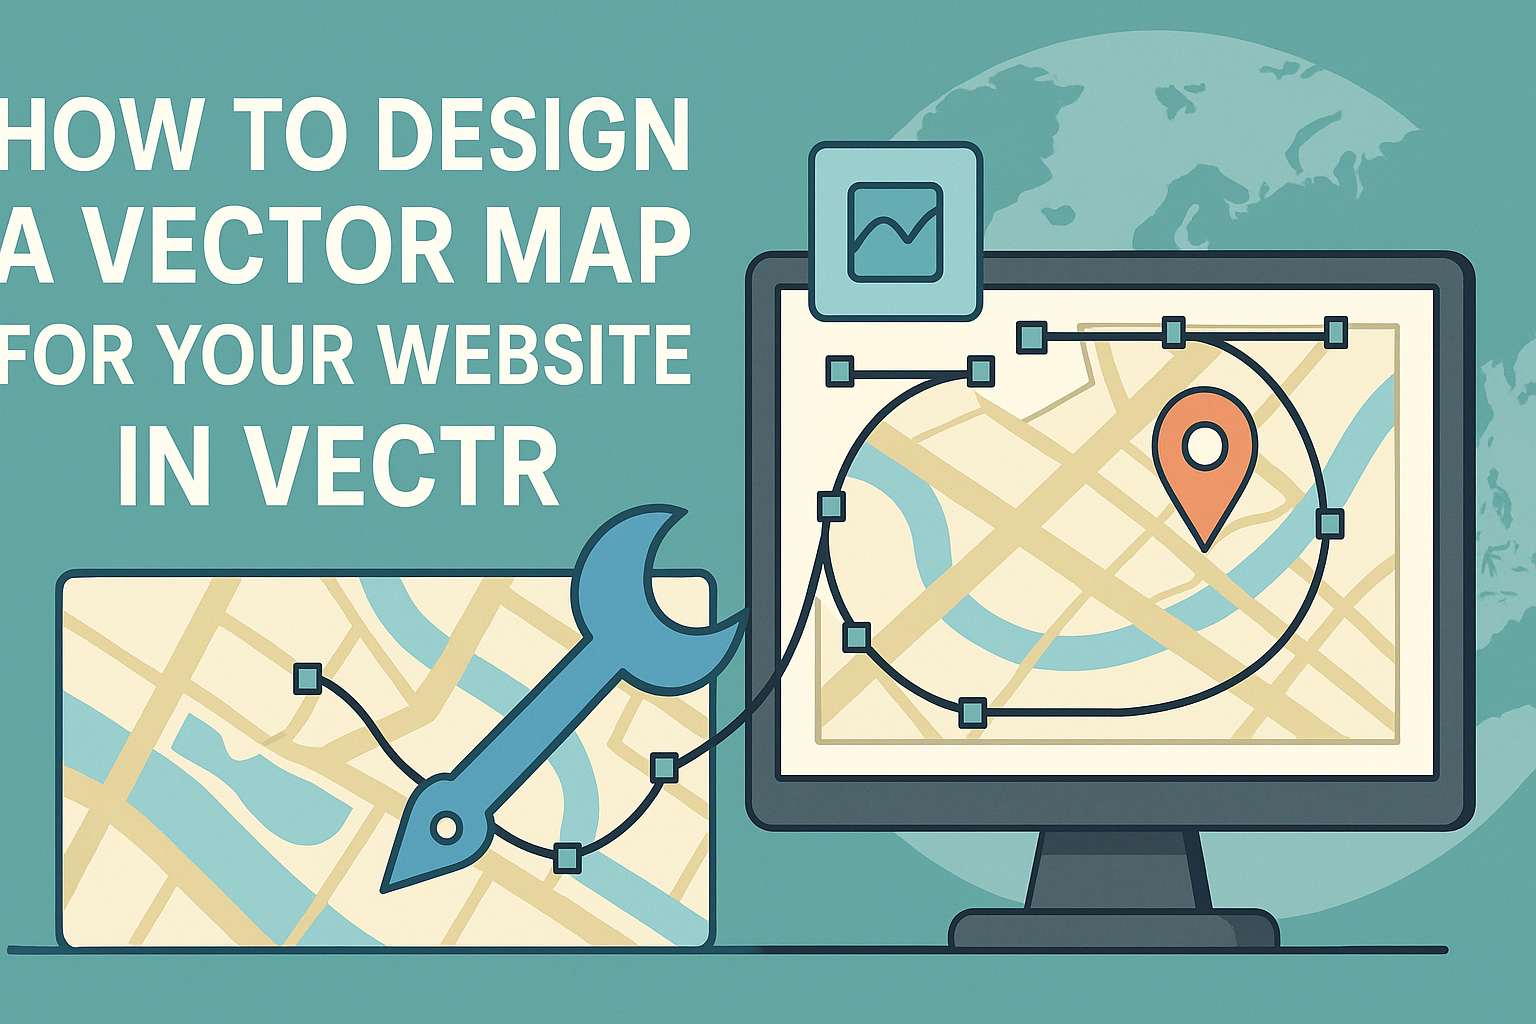
Designing a vector map for a website can enhance user experience and engagement. Vectr makes it simple to create scalable and customizable maps that fit any design need.
This tool offers an intuitive platform where users can bring their mapping ideas to life without needing extensive design skills.
In today’s digital landscape, unique and visually appealing maps can set a website apart. With Vectr, anyone can design eye-catching vector maps that are perfect for showcasing locations, marking routes, or illustrating data.
By learning how to use this tool effectively, users can create maps that not only look great but also serve a clear purpose.
Whether for business, education, or personal projects, a well-designed vector map can provide valuable information to website visitors. With the right approach and tools, crafting an engaging map becomes an enjoyable task that adds real value to any online presence.
Understanding Vector Maps
Vector maps are a powerful tool for web design. They are made of shapes, lines, and colors, allowing for high-quality graphics that can be resized without losing detail.
This section explores what vector graphics are and their key advantages for website design.
Defining Vector Graphics
Vector graphics use mathematical equations to create images. Unlike raster images, which are made up of pixels, vectors maintain their quality at any size. This means they remain sharp, clear, and visually appealing when resized.
Common file formats for vector graphics include SVG, AI, and EPS.
The flexibility of vector graphics makes them ideal for logos, icons, and maps. Designers can easily edit individual elements, change colors, and adjust shapes.
This level of control helps create unique and tailored designs that fit a website’s theme perfectly.
Benefits of Vector Maps for Websites
Vector maps offer several advantages for websites. First, they are easily scalable. Websites can display them on both small and large screens without losing quality. This is essential in today’s world, where users access websites on various devices.
Second, vector maps typically have smaller file sizes compared to raster maps. This helps websites load faster, improving user experience. They also support interactive features, allowing users to zoom in, pan, and see details without any loss in clarity.
Lastly, customizing vector maps is simple. Designers can easily change colors, add labels, and update styles to match the site’s design.
This adaptability makes vector maps a valuable asset for any web designer.
Getting Started with Vectr
Vectr is a user-friendly platform for creating vector graphics. Users can quickly set up their accounts and become familiar with the interface to start designing.
Creating an Account
To use Vectr, one must first create an account. This process is straightforward.
- Visit the Vectr Website: Go to Vectr and click on the “Sign Up” button.
- Provide Information: Users should enter their email address and create a password. They can also sign up using existing Google accounts.
- Verification: A confirmation email may be sent. Clicking the link within verifies the account.
Once the account is set up, users have access to all the features and tools needed for designing vector graphics in Vectr.
Navigating the Vectr Interface
After logging in, users will encounter the Vectr interface. It has a simple layout that is easy to navigate.
- Dashboard: This is where users can see existing projects and create new files.
- Menu Bar: At the top, users will find options to create a new file or access saved projects.
- Sidebar: The sidebar includes tools for adding shapes, text, and images.
Each section is designed for quick access. New users can explore the various features to understand how to utilize Vectr effectively for their projects.
Designing Your Map
Creating a vector map requires careful planning and execution. Properly setting up the workspace and utilizing the right tools can significantly enhance the design process. Understanding how to establish basic shapes, add important details like text and markers, and organize elements is essential.
Setting Up Your Workspace
To start designing a vector map in Vectr, the workspace must be properly organized. Users should open Vectr and create a new document, selecting an appropriate size for their map.
It’s helpful to enable grid lines or guides to ensure elements are accurately placed. Users can customize the background color to contrast with map elements, making them easier to see.
Finally, familiarizing oneself with the toolbar is crucial. This allows for smooth access to tools like shapes, colors, and text options, ensuring a seamless workflow.
Drawing Basic Shapes
Drawing the foundation of the map involves using basic shapes. Users can start by selecting the shape tool in Vectr. Common shapes include rectangles for buildings, circles for parks, and lines for roads.
To draw a shape, click and drag it to the desired size. Adjusting the fill and stroke color will help differentiate elements on the map.
Using a consistent style for shapes creates a cohesive look. Grouping similar shapes together can also help keep the design tidy and organized, making future adjustments easier.
Adding Text and Markers
Text and markers are vital for providing information on the map. To add text, users can select the text tool from the toolbar. Clicking on the map allows them to type in names or labels.
Choosing a clear, legible font is important for readability. Users should consider size and color to ensure text stands out against the background.
Markers can be added to highlight points of interest. Simple icons or shapes can serve as markers to indicate locations like landmarks or services.
Layering and Grouping Elements
Effective layering organizes the map’s elements visually. Users can group shapes and text in Vectr, which helps manage complex designs. Grouping similar items makes it easy to move or edit them as one unit.
The layering feature allows users to arrange elements from back to front. This ensures that important features are visible and stand out.
It’s beneficial to regularly review the map’s organization. Properly named layers help keep track of various components, enhancing the design’s clarity and usability. This method also simplifies any future modifications.
Exporting and Integrating
When designing a vector map for a website, exporting and integrating it correctly are vital steps. Choosing the right format and embedding the map efficiently can enhance the user’s experience.
Exporting Formats for Web
Vectr allows users to export their designs in several formats suitable for the web. The most common formats include SVG, PNG, and PDF.
- SVG (Scalable Vector Graphics): This format maintains high quality at any size and is ideal for web use. It is lightweight and supports interactivity.
- PNG (Portable Network Graphics): A raster format that is excellent for detailed maps with various colors. However, it does not scale as well as SVG.
- PDF (Portable Document Format): Useful for sharing designs easily but not usually used directly on websites.
Selecting the right format depends on how the map will be used and its required quality.
Embedding the Map on Your Website
After exporting the map, the next step is embedding it into the website. For an SVG map, one can directly include it in the HTML file. This method allows for CSS styling and interactivity.
For PNG or JPEG maps, upload the image to a web server and use the <img> tag.
Here’s a simple example:
<img src="your-map.svg" alt="Interactive Map" />
Ensure the map displays correctly on various devices. Responsive design techniques, like using CSS media queries, can help maintain the map’s visibility across different screen sizes.