Creating a balanced scorecard chart can be a powerful way to track and improve performance in any organization.
With Canva, anyone can easily design a balanced scorecard chart by using simple templates and intuitive tools.
This approach not only saves time but also helps in visualizing important data effectively.
Many people find the process of building a balanced scorecard daunting, but it doesn’t have to be.
By breaking down the steps and utilizing Canva’s user-friendly interface, he or she can make this task manageable and even enjoyable.
This blog post will guide readers through the essential steps to create a balanced scorecard chart that aligns with their goals.
Whether for business strategy or personal projects, a balanced scorecard chart can provide valuable insights. Learning how to create one in Canva is a step toward better organization and clarity.
Readers will discover how simple it can be to bring their ideas to life visually.
Understanding Balanced Scorecards
A Balanced Scorecard (BSC) is an important tool used to evaluate an organization’s performance.
It helps managers look at their company in a comprehensive way. This method goes beyond just looking at financial results. It considers multiple perspectives to gauge success.
Definition and Purpose
A Balanced Scorecard is a strategic management system created by Robert Kaplan and David Norton. Its main purpose is to translate an organization’s vision and strategy into measurable objectives.
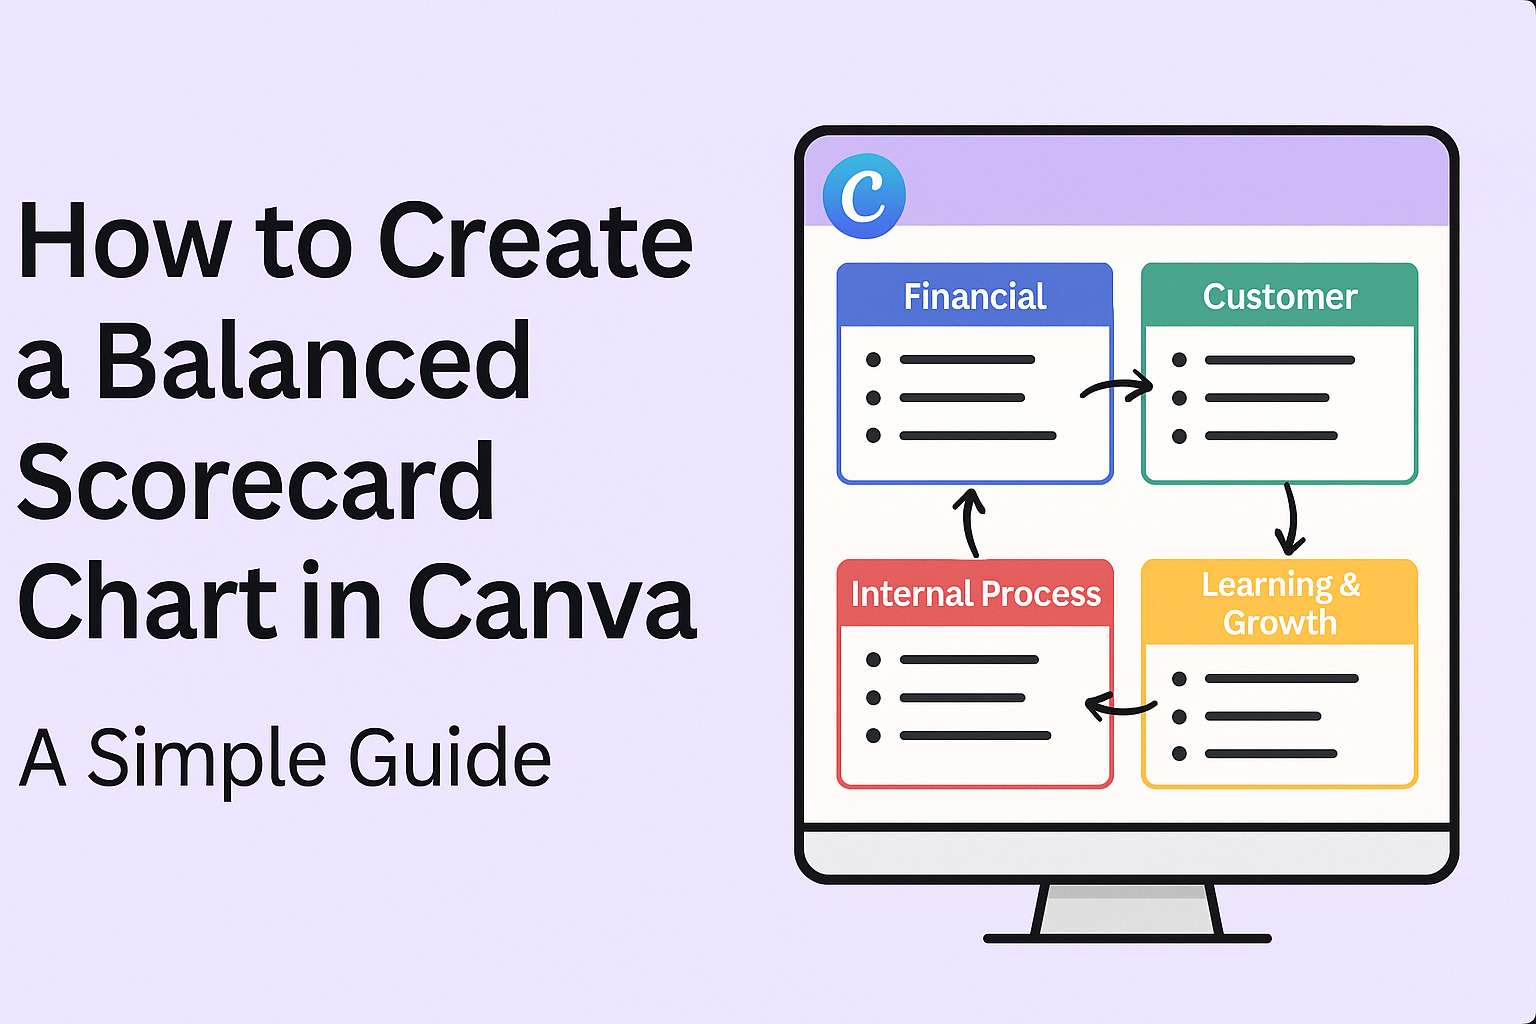
It provides a clear picture of performance using four main perspectives:
- Financial
- Customer
- Internal Processes
- Learning and Growth
These perspectives work together, allowing organizations to measure how well they achieve their goals.
By using BSC, leaders can prioritize projects that align with long-term strategies.
Key Components
The Balanced Scorecard consists of four key components that make it effective.
-
Vision and Strategy: This is where the organization’s long-term goals are defined.
-
Objectives: Specific, measurable targets are set within each perspective.
-
Measures: Indicators are established to track performance against those objectives.
-
Initiatives: Action plans are created to improve performance.
Each component plays a vital role in helping organizations stay focused on their strategic goals.
This framework assists in translating broad goals into everyday actions, leading to better decision-making.
Getting Started with Canva
Canva is a user-friendly design platform that allows anyone to create stunning visuals, including balanced scorecards. Starting with Canva involves setting up an account and familiarizing oneself with the interface to make the most of its features.
Creating an Account
To begin using Canva, the first step is to create an account.
Users can sign up for free using their email, Google, or Facebook accounts.
Once the information is entered, they will receive a confirmation email if needed. Clicking the link in the email will activate the account.
After logging in, users can explore various features. With a free account, they have access to numerous templates and design tools.
For those seeking more advanced options, premium accounts are also available.
Navigating the Interface
After setting up an account, the next step is to navigate the Canva interface.
The main dashboard displays various design templates, categorized for easy access.
On the left side, users will find options like “All your designs,” “Templates,” and “Photos.” This layout encourages quick navigation to find specific assets.
The top toolbar offers critical functions such as “Undo,” “Redo,” and text editing options.
Users can easily add charts by selecting “Charts” from the side panel.
With practice, navigating Canva becomes intuitive, allowing for efficient design creation.
Designing Your Balanced Scorecard
Creating a balanced scorecard chart involves careful design choices. This section will guide the user through selecting templates, customizing layouts, and adding data effectively.
Selecting the Right Template
Choosing the right template is crucial for building a balanced scorecard. Canva offers several professionally designed options tailored to various needs.
When browsing templates, the user should look for layouts that highlight key performance indicators clearly.
It’s helpful to choose a template that suits the industry or business focus. For example, if the emphasis is on customer satisfaction, select a template with customer-centric sections.
Once a template is chosen, the user can easily modify it to fit their needs. This flexibility allows for a personalized touch while maintaining a professional appearance.
Customizing the Layout
Customizing the layout helps make the balanced scorecard visually appealing.
Users can adjust colors, fonts, and sections to reflect their brand identity. It’s important to keep the design consistent throughout the chart.
Using contrasting colors can help to differentiate between different perspectives, such as financial, customer, and internal processes.
Users should also ensure that the text is legible. Keeping font sizes clear and readable makes the chart easier to understand.
Adding icons or images can enhance visual interest. It can help convey information quickly and effectively.
The user should aim for a layout that is both functional and engaging.
Adding Your Data
Inputting data is a key step in creating a balanced scorecard. Canva’s chart template allows users to enter data directly or upload a CSV file.
While adding data, the user should organize it by categories corresponding to the scorecard’s perspectives.
This might include financial metrics, customer feedback, and internal processes.
It’s essential to ensure accuracy when inputting data. Users should double-check the figures to avoid misrepresentation.
Visualizing data through charts or graphs within the scorecard can also make it more informative and engaging.
Finalizing and Sharing
Before sharing a balanced scorecard chart created in Canva, it’s important to review its content and ensure it meets the project’s goals. Then, there are several options for exporting and printing, as well as sharing with stakeholders effectively.
Reviewing Your Scorecard
Reviewing the scorecard is essential for accuracy and clarity.
Check each data entry for typos and confirm that graphs correctly represent the intended information.
Make sure the layout is visually appealing. This can include adjusting colors, fonts, and sizes to enhance readability.
Consider getting feedback from a colleague to ensure the scorecard is clear and communicates the desired metrics effectively.
Lastly, ensure that all sections align with objectives. Verify that every aspect of the scorecard conveys the organization’s strategic goals.
Exporting and Printing Options
Canva offers various options for exporting balanced scorecards. Users can choose from formats such as PNG, JPEG, PDF, and more. Each format serves different purposes, so selecting the right one is crucial.
For presentations, a PDF is often best due to its print quality and professional look. JPEG files work well for web use or when sharing via email.
When printing the scorecard, use high-quality paper to achieve a polished appearance. Adjust print settings in Canva to ensure the scorecard fits the page correctly.
Sharing with Stakeholders
Sharing the scorecard efficiently is vital for strategic discussions.
Canva provides several sharing options, such as generating a shareable link or inviting team members directly via email.
Users can also present the scorecard live using Canva’s presentation mode.
This feature allows stakeholders to see the scorecard in real-time, making it easy to discuss details and ask questions.
For broader distribution, consider exporting the scorecard and attaching it to emails or uploading it to a shared drive.
Providing easy access to this information helps keep all team members informed and engaged.