Canva Magic Insights helps users quickly understand their data by using AI to analyze and summarize information in Canva Sheets. It allows people to select specific cells and get clear insights or answers to questions in just a few clicks. This makes data easier to work with without needing to spend a lot of time on manual analysis.
Anyone working with numbers or tracking progress can benefit from Magic Insights because it highlights patterns and important details automatically. It saves time and helps users make smarter decisions by showing the key points visually.
This blog will guide readers through the easy steps to unlock Magic Insights and get fast, useful results from their own Canva Sheets. Whether they are beginners or more experienced, understanding this feature can improve their workflow.
Getting Started With Canva Magic Insights
Canva Magic Insights helps users analyze data quickly and easily. It works by selecting specific cells or ranges in Canva Sheets and using AI to generate useful summaries or patterns. Users will find tools that make exploring data simple, even without advanced skills.
Accessing Magic Insights in Canva
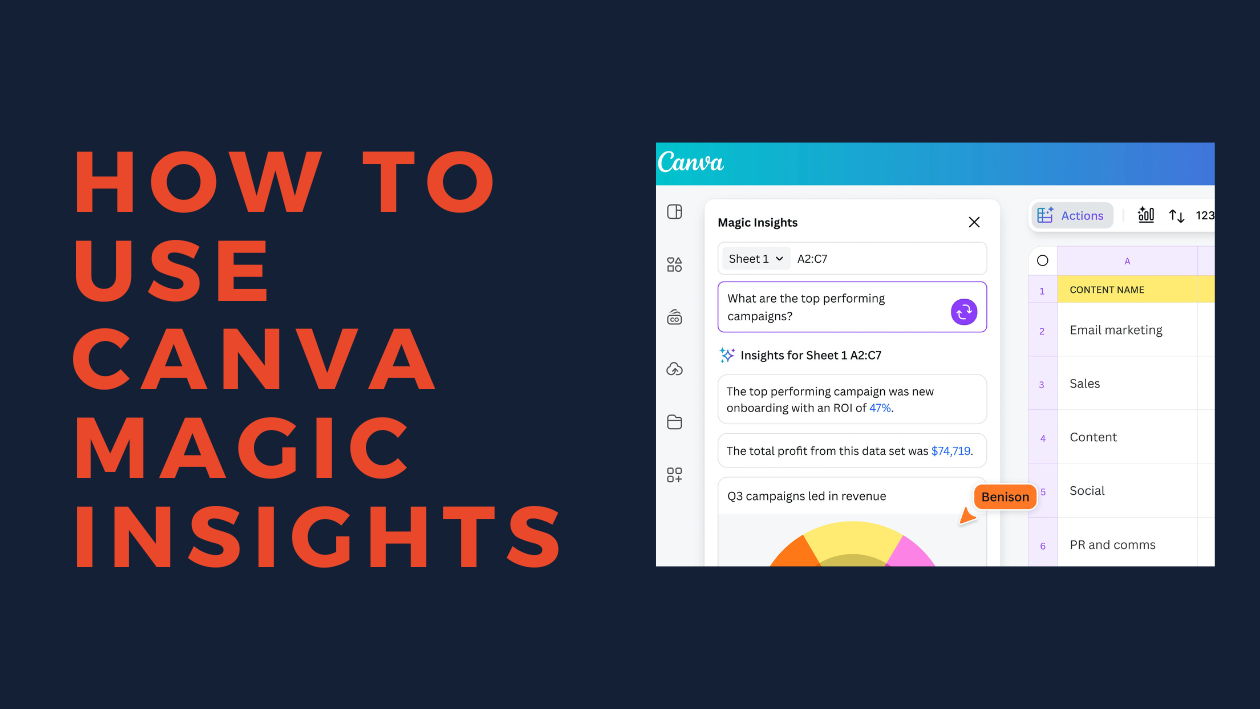
To start with Magic Insights, the user opens a file in Canva Sheets. They can select a range of cells by clicking and dragging, which highlights them with a purple box.
Next, they click the “Actions” button in the floating toolbar. From the dropdown, they choose “Magic Insights.”
At this point, a box appears where they can either type a specific question about the data or leave it blank to get general insights. Then, clicking “Generate Insights” shows the results. This process is easy and quick.
Navigating the Insights Dashboard
After generating insights, users see a dashboard with key points and visual summaries. The dashboard organizes findings into easy-to-read sections like trends, patterns, and key figures.
Users can scroll through responses or ask follow-up questions for deeper analysis. Visual elements like charts and graphs help make sense of the numbers.
The layout keeps everything clean and simple, making it easy to know what the data shows without confusion.
Supported File Types for Analysis
Magic Insights works mainly with data entered into Canva Sheets. It can analyze numbers, text, and dates within these sheets.
Currently, it does not support files outside Canva Sheets, such as PDFs or images. The focus is on spreadsheet-style data to keep analysis precise and reliable.
Users should prepare their data accordingly to get the best output from Magic Insights. For more about using Canva Sheets, check out detailed guides on analyzing data with Magic Insights.
Core Features of Magic Insights
Magic Insights helps users quickly analyze data and get clear results. It breaks down complex information into easy-to-understand visuals and offers useful suggestions for next steps.
Real-Time Data Visualization
Magic Insights shows data changes immediately as users work in Canva Sheets. This instant update means trends, patterns, or errors become visible without delay. Users can select specific cells, and the tool highlights key points using charts and graphs.
Visualization options include bar charts, line graphs, and pie charts. These options make it simple to compare numbers or track growth. The visuals are clean and easy to read, helping people understand data quickly even if they are not experts.
Interactive Recommendations
Magic Insights also gives smart advice based on the data. Once it analyzes the numbers, it suggests formulas, summary points, or ways to improve data layout. This helps users avoid mistakes and save time when working with large spreadsheets.
The tool lets users ask questions or leave the field empty to get top-level insights automatically. This flexibility supports quick decision-making and deeper analysis. Recommendations appear in an easy-to-follow format, making the data more actionable.
Find more details about Magic Insights features in this Canva help article.
Analyzing Your Canva Designs
Understanding how a design performs and connects with its audience helps improve future projects. This involves looking closely at user actions, tracking results over time, and adjusting content based on clear suggestions.
Audience Engagement Metrics
Magic Insights can show detailed data about how people interact with a design. This includes clicks, shares, and time spent viewing. These numbers tell whether the design grabs and keeps attention.
For example, high click rates on buttons or links mean the design guides viewers well. If shares are low, it might need more eye-catching elements. Tracking average view time helps see if people read or just skim.
This data helps identify which parts of a design work best. Users can then make smarter choices in colors, layout, and calls to action to boost engagement.
Design Performance Tracking
Tracking design performance means watching how well the design meets goals over days or weeks. Magic Insights provides updates on views, conversions, and other key numbers.
Charts and graphs visualize trends, making them easy to spot. For example, a rising line for conversions shows growing effectiveness.
This lets users decide when to adjust designs, pause campaigns, or push successful ones harder. Consistent tracking avoids wasting time on weak designs and focuses effort on what brings results.
Content Optimization Suggestions
Magic Insights offers suggestions to improve designs based on the data it analyzes. It might recommend text changes, different images, or tweaks in layout.
These suggestions are clear and easy to apply. For instance, it could advise shorter headlines or brighter buttons to catch the eye.
Following these tips helps users save time and improve designs faster. Instead of guessing, they make changes based on what the data says will work better.
Learn more about Magic Insights for Canva Sheets here.
Customizing and Exporting Insights
Users can adjust their data views to focus on specific details and then easily export their customized reports to share with others. Both filtering and exporting are designed to be simple yet powerful in Canva Magic Insights.
Filtering Results for Deeper Analysis
Filtering allows users to narrow down data to specific values or ranges. They can select particular rows, columns, or data points to analyze trends or patterns that matter most.
To filter, users highlight the cells they want and apply custom conditions like date ranges or numeric values. This helps in spotting anomalies or focusing on top performers without distractions.
Using filters, they can also combine multiple criteria for more precise insights. This makes complex data easier to understand and compare quickly within Canva Sheets.
Exporting Reports to Share
Once satisfied with their insights, users can export the reports in various formats like PDF, PNG, or CSV. These options allow sharing with teammates or including visuals in presentations.
The export process preserves the visual layout and key takeaways, keeping the report clear and professional. Users just select “Export” from the toolbar and choose the preferred format.
Sharing reports becomes faster because the exported files are ready to use without extra editing. This is useful for meetings or sending updates to clients.
Learn more about filtering and exporting with Canva Magic Insights from this Canva tutorial.
Best Practices for Magic Insights
Magic Insights works best when users focus on clear questions and thoughtful use of the data it provides. Paying attention to how insights relate to specific goals helps make the results useful and actionable.
Interpreting Analytics Effectively
When using Magic Insights, it’s important to focus on the data range and the specific cells selected. The AI provides answers based on these details, so choosing the right data is key. Users should ask precise questions to avoid vague or overloaded results.
It helps to look at trends and patterns rather than isolated numbers. For example, instead of just checking sales for one day, look at weekly or monthly trends. Comparing different data points side-by-side clarifies what drives performance.
He or she should also verify any unexpected insights using raw data to avoid errors. Magic Insights is a tool to support decisions, not replace judgment.
Integrating Insights With Design Workflows
Users can link the data insights directly to their Canva design projects. After generating reports or summaries, they can create charts and graphs inside Canva Sheets to visualize results clearly.
Inserting these visuals into presentations or social media graphics helps communicate findings faster and more effectively. This keeps designs and data aligned, streamlining the review process.
To save time, users can set up templates where Magic Insights updates automatically with new data. This makes it easy to keep reports current without rebuilding each time. Using Magic Insights paired with Canva’s drag-and-drop features improves workflow and clarity.
For more details on applying Magic Insights, visit the Canva Magic Insights guide.
Troubleshooting Common Issues
Sometimes Canva Magic Insights might not work as expected. One common reason is using an outdated browser. Keeping the browser updated can fix many problems quickly.
Clearing the browser cache and cookies helps if the tool seems slow or unresponsive. This action removes old data that might cause conflicts.
If the issue continues, users should check Canva’s status page. It shows whether Canva is having widespread service problems.
For those using the Canva desktop app, reinstalling it can solve persistent glitches. This can refresh the app and fix broken files.
Here’s a quick checklist to try when Magic Insights isn’t working:
| Step | What to Do |
|---|---|
| Update Browser | Use the latest version available |
| Clear Cache & Cookies | Remove stored data to improve performance |
| Check Canva Status | Look for any service interruptions |
| Reinstall App | Fresh install if on desktop version |
Following these simple steps can help most users get Magic Insights working again without much fuss.
If problems persist, contacting Canva support might be the next best option to get personalized help.
For more tips on fixing common Canva issues, see this detailed guide on how to fix Canva problems.
Tips to Maximize Value With Magic Insights
To get the best results, users should start by selecting the right data cells carefully. Highlighting the most relevant information helps Magic Insights focus on what matters most and gives clearer answers.
They can also type specific questions or leave the input blank for general insights. Asking clear questions like “What are the top sales trends?” helps Magic Insights provide focused and useful summaries.
It is helpful to use Magic Insights on one page at a time. This keeps the analysis simple and avoids confusion when working with multi-page Canva Sheets.
Using Magic Insights alongside Canva’s Magic Charts can create a powerful combo. While Insights summarizes the data, Magic Charts turn it into easy-to-understand visuals.
To keep track of findings, notes can be added right in the sheet. This makes it easier to revisit key points later without re-running the tool.
Quick Tips:
| Tip | Why It Helps |
|---|---|
| Select focused data | Gets sharper insights |
| Ask clear, specific questions | Guides the AI to useful answers |
| Analyze one page at a time | Avoids mixed or messy results |
| Pair with Magic Charts | Adds easy-to-read visuals |
| Add notes in the sheet | Saves important points for later review |
These small steps make it easier for people to use Magic Insights to its full potential and save time analyzing data. For a detailed guide, see Canva’s Magic Insights help page.
Future Updates and Feature Roadmap
Canva plans to keep improving Magic Insights with new AI-powered tools. These updates will focus on making data analysis easier and faster for all users.
They aim to add better integration with other apps like Google Analytics and HubSpot. This will let users import data more smoothly and get richer insights directly in Canva Sheets.
Some upcoming features might include:
- Enhanced natural language questions for more detailed answers
- Smarter chart suggestions based on the selected data
- Batch editing options to update multiple insights at once
Canva’s Visual Suite 2.0 already offers Magic Charts and Canva Code alongside Magic Insights, which means more powerful tools are coming for designers and data users alike.
Users can expect ongoing improvements in user experience, such as clearer visuals and easier ways to share insights.
For more details about these features and updates, see the info on Canva Visual Suite 2.0 and Magic Insights.