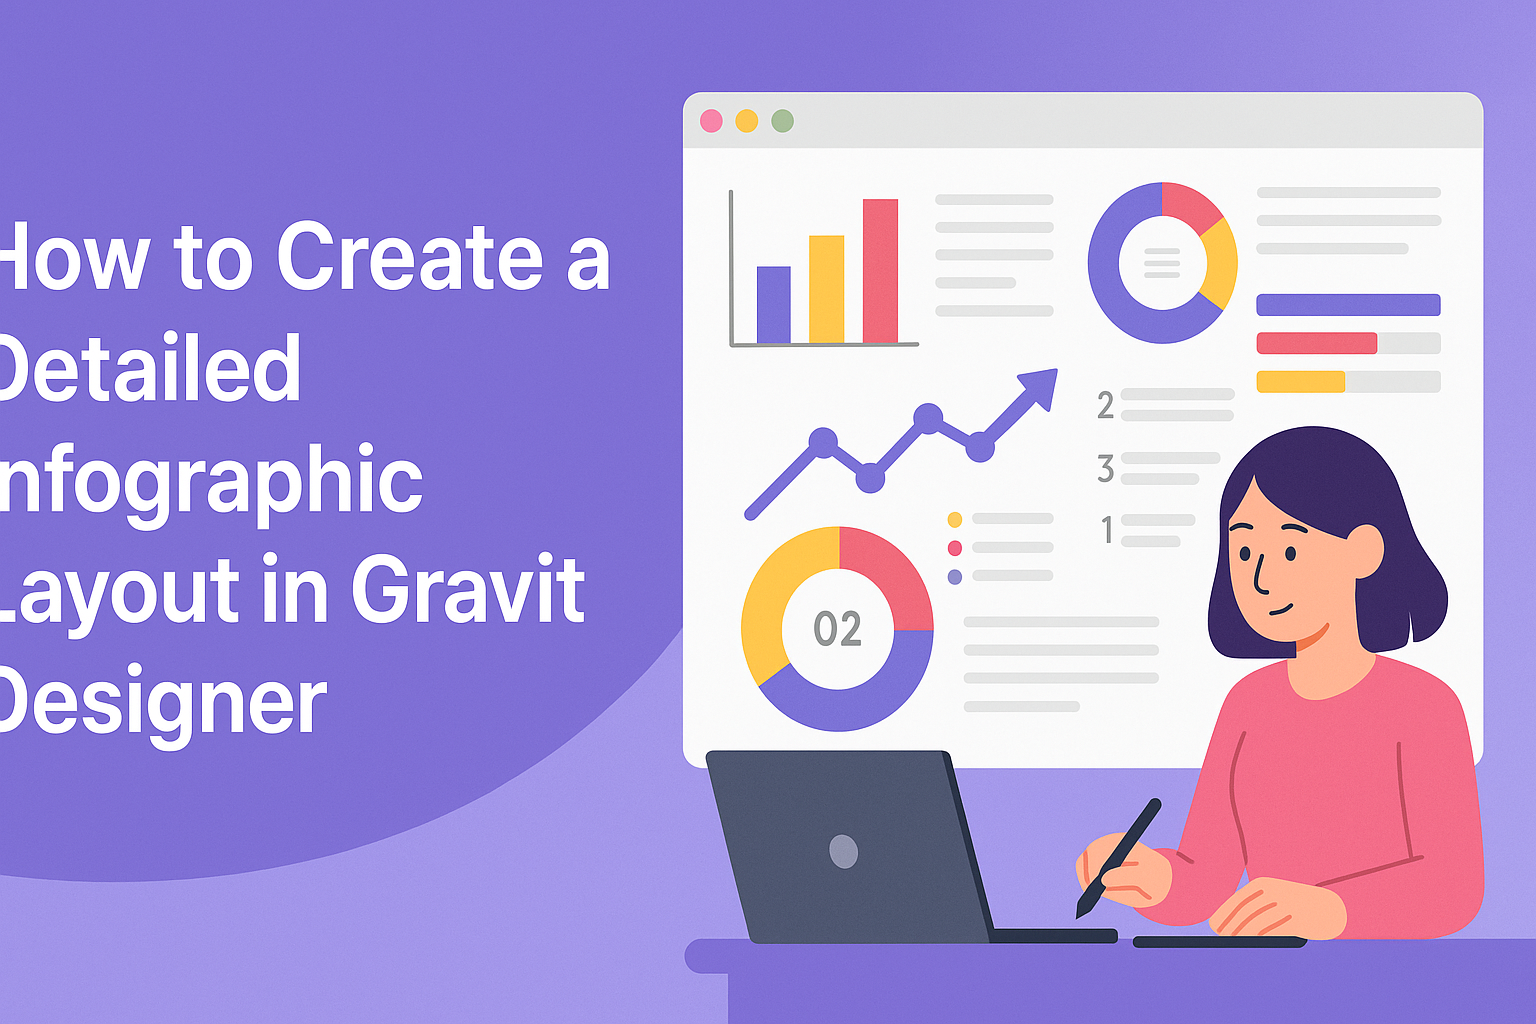
Creating an infographic can be a fun and rewarding way to share information visually.
In Gravit Designer, one can easily layout detailed infographics that capture attention and convey messages clearly. With its user-friendly interface and powerful design tools, anyone can create compelling graphics that impress viewers.
For those looking to enhance their design skills, mastering Gravit Designer is a fantastic choice. From selecting the right shapes to using colors effectively, this tool offers many features for building a polished layout. By combining creativity with these technical skills, one can produce infographics that stand out.
Whether sharing data for a presentation or adding flair to a social media post, successful infographics are essential in today’s content-driven world. This guide will provide step-by-step techniques to create an engaging infographic layout in Gravit Designer, making the process enjoyable for all.
Getting Started with Gravit Designer
Gravit Designer is a user-friendly tool that allows anyone to create stunning graphics and infographics. Understanding its interface, setting up a canvas, and navigating the tools are essential steps for beginners.
Understanding the Interface
The interface of Gravit Designer is designed for clarity and ease of use.
At the top, users find the menu bar with options like File, Edit, and View. Below it, the toolbar provides frequently used tools like selection and shape creation.
On the left side, the layers panel organizes the different components of the design. This helps in managing elements effectively. The right side displays the properties panel, where users can adjust settings like color, size, and opacity.
Familiarizing oneself with these sections will make the design process smoother and more efficient.
Setting Up Your Canvas
To create an infographic, the first step is setting up the canvas.
Upon opening Gravit Designer, users need to select “New Document.” Here, they can choose dimensions suitable for their project. Standard sizes include A4 or custom dimensions based on the infographic requirements.
Once the canvas is created, selecting a background color or image can enhance the design. He or she can easily do this by accessing the properties panel.
An organized canvas helps keep the design process clear and focused, allowing for creativity to flourish.
Navigating the Tools Panel
The tools panel in Gravit Designer is essential for creating designs. It is located on the left side of the interface and contains various tools, from shapes to text options.
Users can click on a shape tool to add elements like rectangles, circles, or polygons. The pen tool allows for more intricate designs and custom shapes.
For text, the text tool opens options for font style, size, and alignment. Discovering and experimenting with these tools enables users to create unique and detailed layouts for their infographics.
Mastering the tools panel is vital for effective design in Gravit Designer.
Designing the Infographic
Creating an infographic involves a mix of colors, fonts, shapes, and layers. Each element plays a key role in how the design comes together and communicates ideas effectively. Below are important aspects to consider when designing an infographic in Gravit Designer.
Choosing a Color Scheme
Selecting a color scheme is one of the first steps in designing an infographic. Colors evoke emotions and can guide viewer reactions.
A good strategy is to choose a palette that reflects the topic. For instance, a health-related infographic might use greens and blues. Tools like Adobe Color or Coolors can help find color combinations that work well together.
It’s important to limit the number of colors used. A palette with three to five colors keeps the design cohesive. Use contrasting colors for text and backgrounds to enhance readability.
Test colors on different screens to ensure they display correctly. Consistency in color usage throughout the infographic reinforces messaging and branding.
Selecting Fonts and Typography
Font choice greatly affects the infographic’s tone. It’s essential to choose fonts that are easy to read and align with the overall theme.
Typically, using two to three different fonts works best. One font can be for titles, while another can serve for body text. A decorative font adds flair but should be used sparingly.
Pay attention to font size and spacing to improve legibility. Titles should be larger and bolder than body text. Maintain sufficient line spacing, as this helps readers follow along more easily.
Lastly, avoid using too many font styles. Sticking to a cohesive typography scheme helps the infographic look polished and professional.
Adding and Manipulating Shapes
Shapes are fundamental in creating visual interest and organizing information. In Gravit Designer, various shapes like circles, rectangles, and lines can be utilized.
Begin by deciding what shapes best represent the data. For example, circles can highlight statistics, while arrows can indicate flow.
Manipulating shapes is easy. Users can resize, rotate, and color them to fit their infographic’s theme. Grouping related shapes together keeps the layout tidy and manageable.
Utilize transparency and layering to add depth. This technique can help focus attention on specific areas or data points. Keeping the composition balanced contributes to an appealing design.
Using Layers and Groups
Layers and groups help keep designs organized. Each new element should be created on a separate layer. This allows for easy editing without disturbing other components.
Grouping similar elements, like icons or shapes, makes adjusting their position simpler. It keeps the work area neat, especially in complex designs.
Gravit Designer allows users to lock layers to prevent accidental edits. This is especially useful when working with multiple layers. Naming layers and groups can make navigation easier.
Utilizing these features can significantly streamline the design process. A well-organized workspace promotes creativity and efficiency, leading to a better final product.
Inserting Content
Adding content to an infographic is a crucial step. This section covers how to import images, add text, and incorporate graphs or charts. Each element helps convey information clearly and attractively.
Importing Images and Illustrations
To start, users can easily import images and illustrations into Gravit Designer.
They can do this by selecting File > Import from the top menu. This allows them to choose images stored on their device. Once imported, users can drag and resize the images as needed.
It’s helpful to keep image quality in mind. High-resolution images ensure clarity when the infographic is shared or printed. Users can also use illustrations from libraries within Gravit Designer. This feature provides various graphics that enhance visual appeal and relevance.
Adding Text Elements
Text is key in any infographic because it delivers core messages.
Gravit Designer offers a Text tool on the left toolbar, which is simple to use. By clicking on the canvas, users can create a text box. They can type in their content directly, which allows for easy editing.
Changing the font style, size, and color can make text stand out. Users should choose readable fonts to attract attention without overwhelming the viewer. Using bold or italic styles can emphasize important points. Organizing text into bulleted lists can also help break up information, making it digestible.
Incorporating Graphs and Charts
Graphs and charts add valuable data to an infographic.
To create these elements, users can go to the Shapes tool. They can select various shapes like bars, lines, or pies to represent data.
Once the shapes are chosen, they can customize colors and sizes. This customization allows the visual elements to align with the overall design. It’s essential to include clear labels and legends. This ensures viewers understand the data being presented.
For more advanced charts, users might consider external tools to create them before importing. This approach can enhance the overall professionalism of the infographic.
Finalizing and Exporting Your Infographic
Before exporting an infographic, it’s important to add finishing touches and select the correct file format for distribution. This will ensure that the final product looks polished and is ready for any platform.
Applying Finishing Touches
To give the infographic a professional look, careful attention should be paid to the little details. This includes checking for spelling and grammatical errors. A fresh set of eyes can help catch mistakes.
Next, ensure all graphics are aligned neatly. Using Gravit Designer’s alignment tools can help make sure that elements are centered or evenly spaced.
Adding consistent fonts and color schemes enhances readability. Adjusting opacity on certain elements can create layers without cluttering the design. Lastly, adding a logo or a small credit at the bottom helps maintain brand identity.
Exporting for Web and Print
When it comes to exporting, selecting the right file format is crucial.
For web use, exporting in PNG or JPEG ensures that the colors are vibrant. Both formats support high-resolution graphics.
For print, opting for PDF provides a high-quality finish. It keeps the details sharp and preserves the design’s layout.
In Gravit Designer, users can select the specific dimensions needed for print or web to fit their needs.
Finally, consider testing the exported files on different devices. This ensures everything appears as intended.
Saving the original project file allows for future edits or updates.