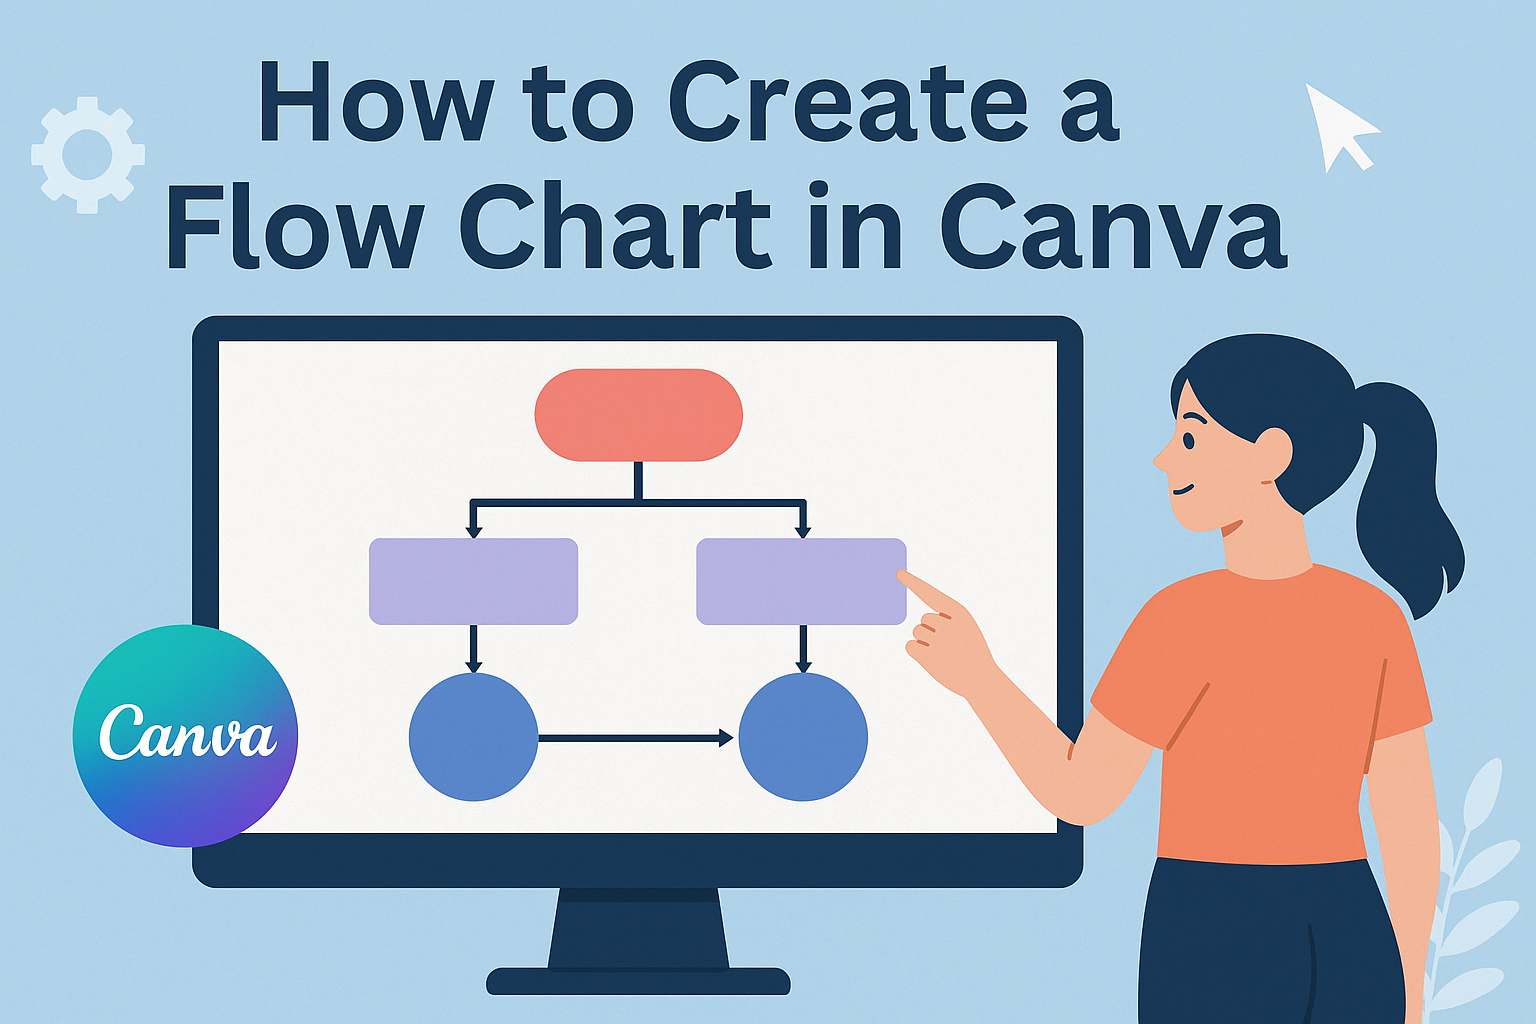
Creating a flow chart doesn’t have to be complex. With tools like Canva, anyone can design a clear and effective flow chart to visualize processes and ideas.
To create a flow chart in Canva, start by selecting a ready-made template or begin from scratch. Then, customize it with different shapes, lines, and text options.
Canva offers a variety of features that make designing easy and fun. Users can choose from many templates, icons, and symbols, ensuring the chart is both informative and visually appealing.
By using drag-and-drop functionalities, adding and arranging elements becomes a breeze.
A great flow chart enhances understanding, making complicated concepts simpler. Whether it’s for business processes, educational purposes, or creative projects, a well-designed chart can make a big difference.
Explore the step-by-step guide in the following sections to see how easy it is to bring your ideas to life.
Getting Started with Canva
To create a flowchart using Canva, it’s essential to first set up an account and familiarize oneself with the dashboard. This provides access to a range of tools and templates useful for flowchart design.
Creating a Canva Account
The first step in using Canva is to create an account. Users can sign up for free or choose a paid plan for additional features.
They can register using an email address, Google account, or Facebook account. After signing up, it’s important to verify the email address to activate the account.
Once the account is set up, users can explore free and premium templates available for different design projects. Paid plans offer more customization options, advanced tools, and additional storage space.
Whether using a free or paid account, Canva provides flexibility in design activities.
Overview of Canva Dashboard
The Canva dashboard is the main interface where users start their creative projects. It is designed to be user-friendly, offering easy navigation between various design tools. On the dashboard, users can find options like Templates, Projects, and Brand Kit.
Templates are a great starting point for creating flowcharts, and they are easily customizable. The Projects tab serves as a collection of past works, allowing easy access and duplication. The Brand Kit is useful for branding purposes, enabling users to upload logos, choose fonts, and select color palettes to maintain brand consistency across designs.
Familiarity with the tools and layout makes it easier to access what users need, streamlining the design process.
Understanding Flow Charts
Flow charts are powerful tools used to represent processes visually. They help organize and simplify complex tasks by breaking them down into steps, using various symbols to demonstrate different actions or decisions.
Purpose of Flow Charts
Flow charts serve a crucial role in both educational and professional settings. They are used to map out processes, making complicated information more accessible. This visualization aids in identifying areas for improvement, gaps, or bottlenecks in a process.
Teachers use them to illustrate concepts, while business professionals rely on them for strategic planning and decision-making. By laying out each step, flow charts make it easier for everyone to understand and follow a process. They are vital for enhancing communication and collaboration across teams.
Common Symbols and Their Meanings
Flow charts use a variety of symbols, each with distinct meanings. The oval shape represents the start or end of a process. Rectangles are used for standard steps or tasks within the flow.
Diamonds indicate decision points, requiring a yes/no or true/false answer that directs the flow to different paths. The arrows show the direction of the flow, connecting each step in the sequence.
Parallelograms are used for input and output, indicating data entry or information retrieval processes. These symbols help create a clear and organized flow chart that is easy to understand and follow.
Setting Up Your Canva Canvas
When creating a flowchart in Canva, it’s important to choose the right design type and customize the canvas size to suit your needs. Proper setup of your canvas can make the process smoother and your final product more effective.
Selecting the Right Design Type
Choosing the right design type is the first step in crafting a successful flowchart. Canva offers a wide range of templates, including specific ones for flowcharts. Templates provide a helpful starting point, offering pre-defined layouts and design elements.
To begin, users can browse flowchart templates by searching for “flowchart” in the Canva search bar. This makes it easy to get started without designing everything from scratch.
Each template can be customized with different colors, fonts, and styles to match the user’s vision.
Selecting a relevant design type helps organize steps and ensure the flowchart is clear and easy to read. A well-chosen template can greatly reduce the time spent on structure and increase focus on content details.
Customizing Canvas Size
Customizing the canvas size is crucial for ensuring the flowchart fits perfectly into its intended medium, whether it’s a presentation, a document, or a poster. Canva lets users adjust the dimensions of the canvas to align with their specific requirements.
To resize the canvas, users can locate the “Resize” button at the top right of the Canva interface. Here, they can input custom dimensions or select from preset dimensions like A4, letter, or social media-specific sizes.
Adjusting the canvas size ensures that the flowchart is displayed correctly on any platform. Setting the correct dimensions at the beginning can prevent resizing issues later, saving time and maintaining clarity in the visual representation.
Designing the Flow Chart
When designing a flow chart in Canva, it’s essential to focus on key elements like shapes, connections, and labels. These building blocks help create a clear and comprehensible diagram for any process.
Adding and Editing Shapes
In Canva, users can start by choosing from a variety of shapes available in the side panel. Simple shapes like circles, squares, and rectangles are commonly used to represent different steps or actions.
Customizing Shapes:
- Resize: Click and drag the corners of a shape to resize according to your needs.
- Color: Use the color picker tool to match your chart’s theme.
- Borders: Add or adjust borders for emphasis.
Experimenting with different shapes helps in matching the chart to its intended purpose.
Connecting the Elements
Once the shapes are in place, connecting them appropriately is crucial. Canva provides various line and arrow styles for creating these connections.
Connecting Shapes:
- Lines and Arrows: Select the line tool and draw connectors between shapes to show the flow of steps.
- Arrow Styles: Adjust arrowheads for direction clarity.
Aligning and Positioning:
- Ensure elements are evenly spaced and aligned. Canva’s gridlines are useful for this.
- Snap options make sure lines are perfectly connected to shape edges.
These connections illustrate the sequence and relationship between steps effectively.
Inserting Text and Labels
Texts and labels play a fundamental role in explaining each part of the flow chart. Canva’s text tools make it easy to add descriptions to shapes and connections.
Adding Text:
- Select a shape and choose the text box tool to add labels directly on or near the shape.
- Adjust font size and style to ensure readability.
Formatting Tips:
- Use bold or italics for emphasis.
- Keep the text concise to avoid cluttering.
Labels clarify the purpose of each shape and the sequence in the chart, making it accessible and understandable.
Customizing the Design
Personalizing a flowchart in Canva involves selecting a color palette, choosing suitable fonts, and using Canva’s resources effectively. These elements can transform a simple diagram into a visually appealing and clear document.
Choosing a Color Scheme
Colors play a crucial role in making a flowchart attractive and easy to understand. Users can start by choosing complementary colors that align with the theme or purpose of the flowchart. Canva offers pre-designed palettes for different moods or themes to help with this.
Using too many colors might make the chart confusing. It’s best to limit the palette to three or four colors. This creates a cohesive look and helps emphasize important sections.
Adjusting the color intensity slightly can also create depth and highlight key parts of the chart.
Applying Fonts and Typography
Typography sets the tone for the entire flowchart. Canva provides a diverse range of fonts to match the style and purpose of the document.
Users should pick fonts that are legible and professional, especially if the flowchart is being used for presentations or reports.
Pairing fonts can bring contrast and balance. Using a bold font for headings and a simpler one for the details helps maintain clarity.
Careful spacing and font size ensure the text is easy to read without overwhelming the visuals. Customizing font color to match the chosen color scheme ties everything together.
Utilizing Canva’s Design Assets
Canva’s design assets include icons, shapes, and lines that enhance flowchart designs. These elements can be used to represent different parts of a process or to direct the viewer’s attention.
Users should browse through Canva’s library to find the right elements that suit their flowchart.
Icons help convey messages quickly without adding clutter. Shapes like circles and squares can organize information clearly, while arrows guide the flow of the chart.
Consistency in using these assets is key to maintaining a tidy and professional design. Always check that elements are aligned correctly to keep the flowchart neat.
Collaboration and Sharing
Collaborating on a flow chart in Canva is a simple process. Users can invite team members to edit or comment, and flow charts can be shared easily with others through links.
Inviting Team Members
Inviting team members to collaborate on your Canva flow chart is straightforward. The design owner or someone with edit access can initiate this process.
By selecting the “Share” option in the editor, they can open a link to collaborate. This link can be shared with others. There is also flexibility in choosing access levels, such as view-only or comment-only rights, which helps maintain control over the content.
This feature fosters teamwork by allowing input from various perspectives, enhancing the flow chart’s effectiveness with shared insights.
Sharing Your Flow Chart
Sharing your flow chart in Canva is made easy with a variety of options. After opening the design, users can click on “Share” in the editor.
A collaboration link can be generated, and settings can adjust access rights, like allowing others to view, edit, or comment.
Selecting “Anyone with the link” simplifies the sharing process, enabling quick distribution without needing to worry about login requirements.
This method is particularly helpful for sharing finalized designs with clients or colleagues who don’t need full editing rights. By managing these settings, users can control how their flow charts are accessed and interacted with.
Exporting Your Flow Chart
Exporting your flow chart from Canva is a straightforward process, but choosing the right file format and quality settings is key. We will explore the different formats available and guide you through downloading your final design easily.
File Formats and Quality Settings
Canva offers several file formats for exporting designs. Users can choose between PNG, JPG, PDF Standard, and PDF Print. Each format serves different purposes.
For high-quality images that need to look sharp on digital platforms, PNG is a great choice. JPG is suitable for smaller file sizes with slight quality trade-offs.
When exporting for printing, PDF Print is recommended. It provides high-resolution outputs ideal for professional printing.
Canva allows adjustment of image quality settings to fit specific needs. Users can select standard quality for web use or high quality for printing and detailed views.
Understanding these settings ensures the flow chart meets its intended purpose, whether it’s for digital sharing or professional presentations.
Downloading Your Design
Once the file format and quality settings are chosen, downloading the flow chart is simple.
On the Canva interface, locate the Download button at the top right corner. A menu will appear, allowing selection of the desired file format and quality.
After setting preferences, click the Download button to save the design to your device.
Make sure to check storage availability on your device to avoid issues. The download speed may vary depending on the file size and internet connection.