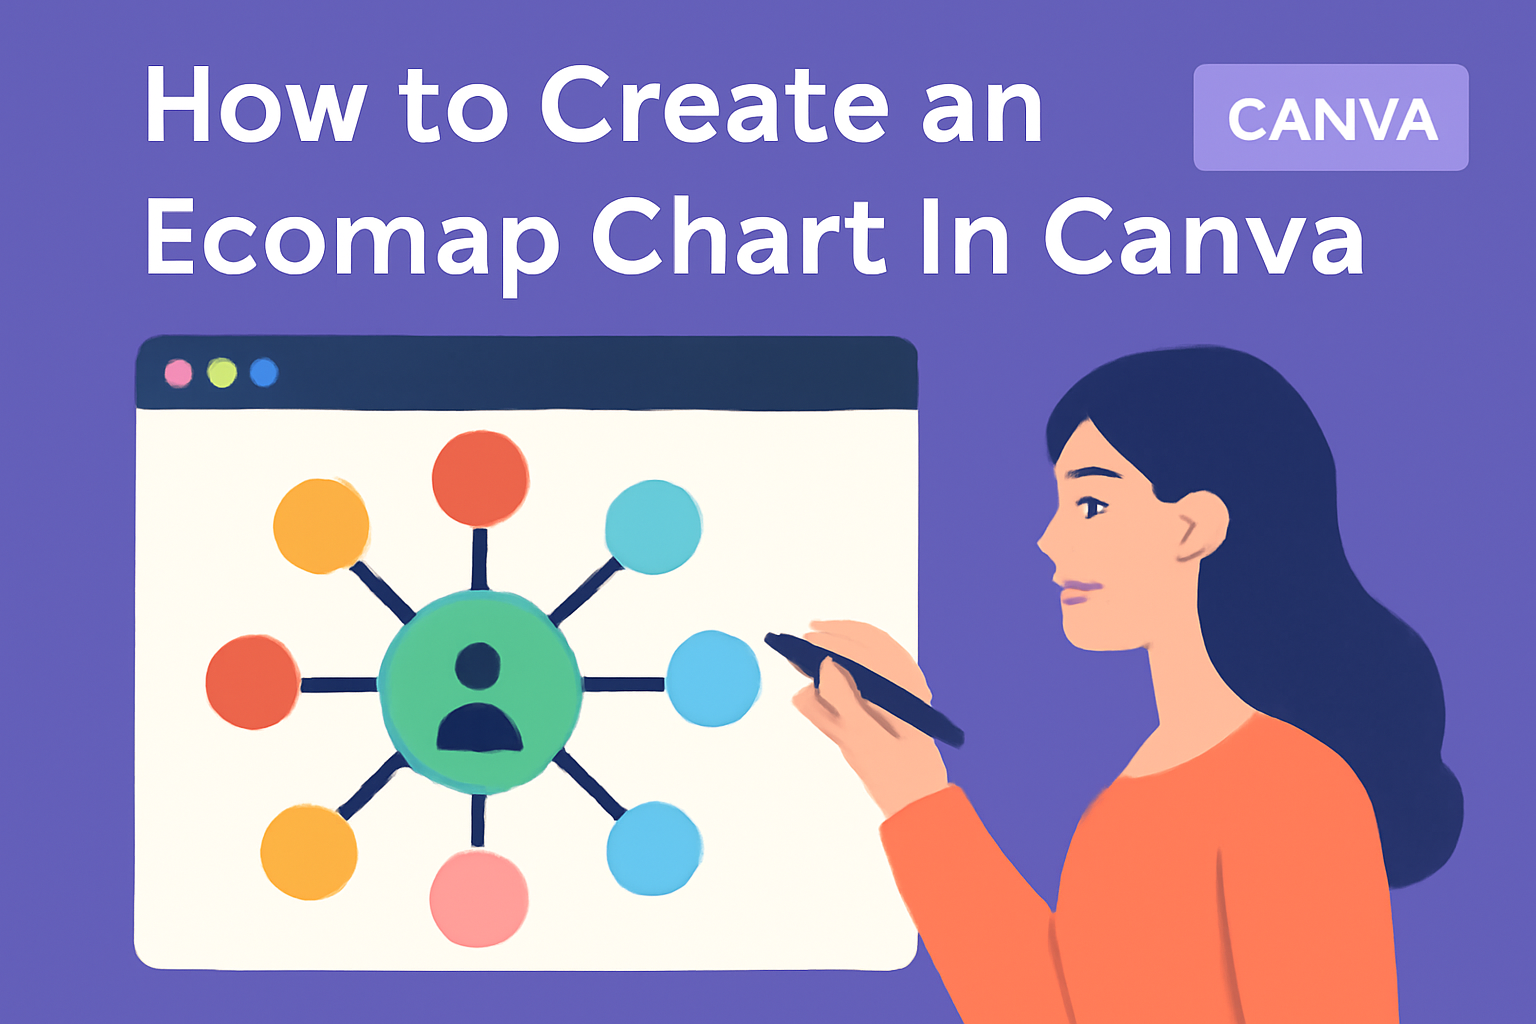
Creating an Ecomap chart is a fantastic way to visualize relationships and connections within a community or family system. With the right tools, anyone can bring their ideas to life in a clear and organized manner.
Canva makes it easy for users to create stunning Ecomap charts with simple steps and customizable templates.
In this blog post, readers will discover how to effectively use Canva to design their own Ecomap charts. With its user-friendly interface and various design options, Canva allows for creativity while keeping projects straightforward.
This guide will lead them through each step, ensuring they feel confident in their ability to make a meaningful diagram.
Whether for academic projects, social work, or personal use, mastering Ecomap creation can enhance understanding and communication. By following this guide, readers will be empowered to craft charts that clearly represent their unique perspectives and relationships.
Understanding Ecomap Charts
Ecomap charts are visual tools that display the relationships between a person or a family and their social environment. They help in recognizing the connections and influences that impact a person’s life.
Definition and Purpose
An ecomap is a diagram that showcases the interactions between an individual or family and their surroundings. It visually represents personal and social connections, including relationships with friends, family, and various institutions like schools and workplaces.
The primary purpose of an ecomap is to provide insight into these relationships. It helps identify strong connections and potential support systems, as well as areas where a person may feel isolated or unsupported. This understanding can aid social workers, therapists, and individuals in addressing needs and enhancing support networks.
Components of an Ecomap
Ecomaps consist of several key components that make them effective for visualizing relationships.
- Center Circle: This usually contains the person or family being mapped.
- Surrounding Symbols: These represent people, organizations, and other elements that interact with the center circle.
- Lines: Different types of lines indicate the nature of relationships. Solid lines may show strong, supportive connections, while dotted or wavy lines can indicate weaker ties.
Other symbols can represent institutions like schools, workplaces, or support groups. Each component plays a crucial role in illustrating the social landscape surrounding the individual or family.
Benefits of Using Ecomap Charts
Ecomap charts offer several benefits in various settings.
- Visual Clarity: They provide a clear picture of connections and relationships, making it easier to identify strengths and challenges.
- Facilitates Communication: This tool can help individuals express their feelings about relationships and support systems more clearly.
- Guides Problem-Solving: By visualizing the network, it helps identify areas where additional support is needed.
Using ecomaps can lead to more effective strategies for personal improvement and enhanced support systems. They are especially useful for social workers or counselors when assessing a client’s situation.
Getting Started with Canva
Canva offers an easy way to create stunning designs, including ecomaps. To begin, users must first create an account and then learn how to navigate the interface effectively.
Creating an Account
To use Canva, it is necessary to create an account. Users can sign up by visiting the Canva website. They have the option to register using an email address, Google account, or Facebook account.
Once they choose a method, users will fill in the required information and click “Sign Up.” After signing up, users may receive a confirmation email. It’s essential to confirm the email to access all features.
Canva offers a free plan with many tools. For users looking for more options, upgrading to a paid plan is also available.
Navigating the Canva Interface
Navigating Canva is straightforward once logged in. The homepage features a clean layout with various sections.
On the left side, users will find a menu with design types, including presentations, social media graphics, and more. Clicking on “Templates” reveals ready-made designs that can spark inspiration.
The center area displays selected templates or documents in progress. Users can access their projects here.
At the top, there are essential tools like “Resize,” “Elements,” and “Text” for adding features to the design.
Lastly, the right side has options to save, share, or download designs. Familiarizing himself with these features helps users create their ecomaps easily.
Designing Your Ecomap
Creating an ecomap is a visual way to show relationships and connections. When designing an ecomap, choosing the right template, customizing design elements, and adding clear text are all important steps.
Selecting a Template
Canva offers a variety of ecomap templates that can simplify the design process. Users can start by visiting the ecomap section and browse through different styles. Each template is designed to serve specific needs and can be easily modified.
When selecting a
Sharing and Collaborating
Sharing the ecomap with teams is easy using Canva’s collaboration features.
Users can invite others to view or edit the chart directly in Canva. This is done by clicking on the “Share” button and entering the email addresses of collaborators.
For presentations, it’s possible to publish the ecomap online.
Clicking the “Publish” button allows sharing via a unique link. This helps facilitate discussions and gather feedback efficiently, making the ecomap a reliable tool for team projects and community engagement.

